
The top healthcare payer companies in the US depend on the market. UnitedHealthcare and Humana lead Medicare Advantage, Centene leads the ACA individual market, and five firms hold 47% of Medicaid managed care. For a practice, your own payer mix and each contract's terms matter more than a national ranking.
A payer (also spelled payor) is any organization that pays for care on a patient’s behalf: Medicare, state Medicaid programs, and commercial insurers. A national list of big names tells a practice little, because the payers that set your cash flow are the ones in your zip code and on your claims.
Key takeaways
- Leaders differ by market: Medicare Advantage, Medicaid managed care and the ACA individual market each have different top firms.
- Local share beats national rank: in 2024 one insurer held 42% of Florida’s individual market and another held 40% of Texas’s.
- Marketplace plans denied 20% of in-network claims on average in 2023, with insurers ranging from 1% to 54%.
- Keep, add or drop a payer based on your own claims data, contract terms and enrollment status, not on membership size.
Who are the top healthcare payer companies by market?
There is no single top-five list that fits every practice. Size depends on the market you count, so the sourced figures below are split by Medicare Advantage, Medicaid managed care and the ACA individual market.
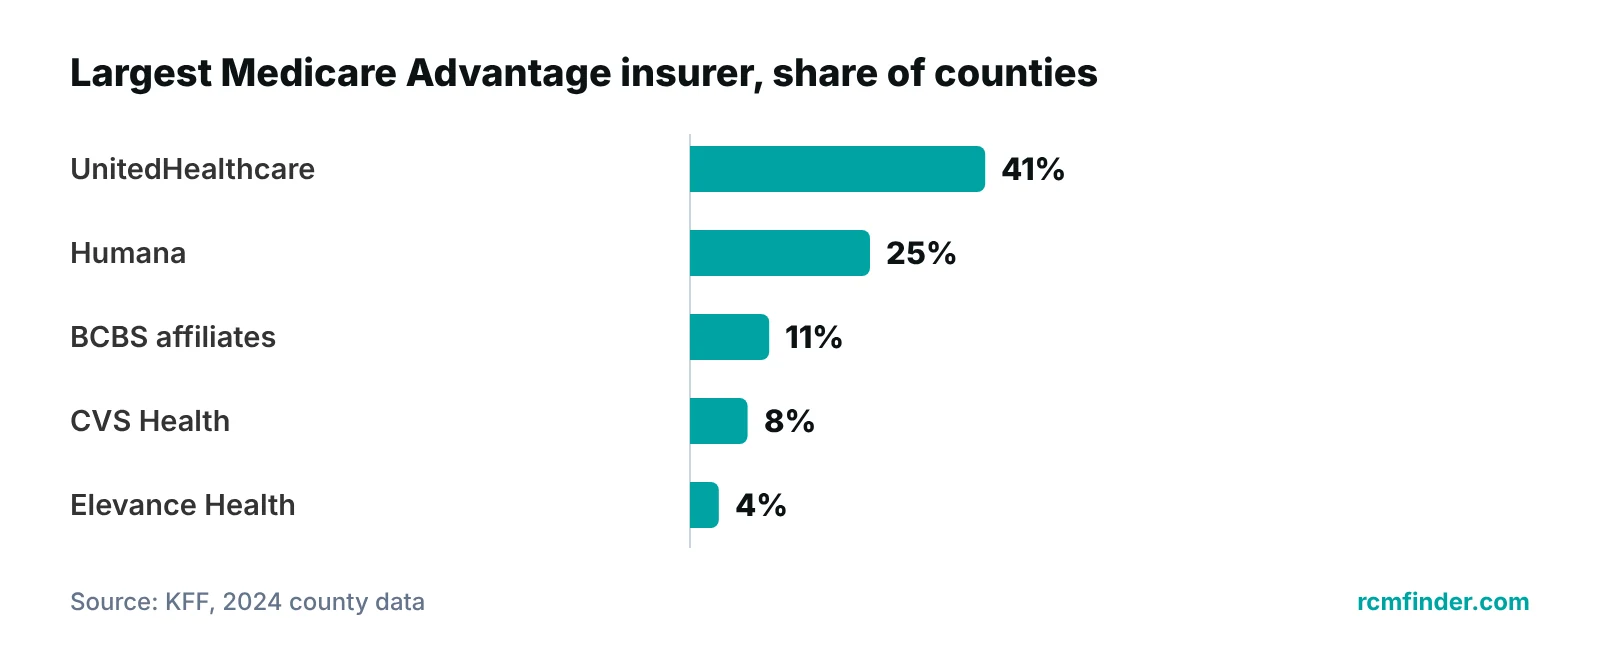
In Medicare Advantage, KFF reports about 34 million people (54% of eligible beneficiaries) were enrolled in 2025. KFF’s county-level analysis of 2024 data found UnitedHealthcare had the largest enrollment in 41% of counties and Humana in 25%, and the two together held 47% of Medicare Advantage enrollment (KFF).
| Market | What the data shows | Data year | What it means for your billing |
|---|---|---|---|
| Medicare Advantage | About 34 million enrollees, 54% of eligible beneficiaries. UnitedHealthcare was largest in 41% of counties, Humana in 25%, BCBS affiliates 11%, CVS Health 8%, Elevance Health 4%. | 2024 county data; 2025 enrollment | Each plan applies its own authorization and appeal rules, so check them plan by plan. |
| Medicare Advantage, one-year change | Among the five largest insurers, Humana added about 1.2 million enrollees (Feb 2025 to Feb 2026) and Kaiser about 64,000. UnitedHealth Group lost over 530,000, Elevance about 368,000 and CVS about 29,000. | Feb 2025 to Feb 2026 | Share moves year to year; re-check your mix each year. |
| Medicaid managed care | 78% of Medicaid beneficiaries (over 66 million) were in comprehensive managed care. Centene, UnitedHealth Group, Elevance, Molina and Aetna/CVS together held 47% of MCO enrollment. | July 1, 2024 | Your state sets the program; the managed care plan processes your claims. |
| ACA individual market | 22.3 million people. Centene covered 4.1 million (18%), HCSC 1.9 million (9%) and CVS 1.8 million (8%). | 2024 | Plan networks and denial rates vary by insurer and state. |
| State examples, individual market | GuideWell Mutual Holding Group held 42% of Florida (1.52 million of 3.65 million). HCSC held 40% of Texas (1.42 million of 3.54 million). | 2024 | One payer can set your whole commercial schedule in a state. |
Source: KFF (2024 county data, 2025 and 2026 enrollment briefs, 2024 Medicaid and individual-market tables).
Kaiser Permanente is on the list of large Medicare Advantage insurers, but it is an integrated system, not a network most outside practices apply to join. Treat it as a market player to understand, not a contract to chase.
Why does your local payer mix matter more than a national ranking?
Because payment, rules and denials are set at the plan and state level. The KFF individual market tables show how different the leaders are by state: in 2024 one group held 42% of Florida and another held 40% of Texas, while nationally the largest insurer held 18%.
The same logic applies to your practice. A payer with a modest national share can be 30% of your visits if your community has a large employer on that plan. A payer that dominates the news can be 2% of your revenue.
“A practice manager is better served knowing exactly where the last 12 months of revenue came from than knowing which insurer is biggest on a list.”
Concentration also changes your leverage. When one or two insurers hold half or more of a local market, as KFF found for 90% of eligible Medicare Advantage beneficiaries in 2024, a practice that drops the dominant plan may lose a large share of its patients. That is a business decision to make with numbers, not on a hunch.
Pull your own numbers before reading anyone’s ranking. The table below turns that into a short review you can do with a billing report.
| Question | Where to find it | What to do with the answer |
|---|---|---|
| What share of collected revenue does each payer account for? | Payment posting or revenue report, last 12 months | Rank payers by dollars, not by visit count. |
| How often does each payer deny, and why? | Denial report by payer and reason code | Flag any payer whose denials come from fixable front-end errors. |
| How long do claims sit unpaid by payer? | A/R aging by payer | Find payers where money is stuck, then check contract terms. |
| Is every provider enrolled and active with each payer? | Enrollment tracker, payer rosters | Fix gaps before renewing or adding a location. |
| Are you paid at or below your contracted rate? | Remittances compared with the fee schedule | Send underpayments back for correction. |
What do payer size and market share mean for denials and payment?
Size does not predict how a payer treats your claims. The best sourced evidence is the spread between insurers. In KFF’s analysis of 2023 ACA marketplace data, in-network claims were denied at an average rate of 20% (86 million of 436 million claims), but individual insurers ranged from 1% to 54%. Fewer than 1% of denied claims were appealed.
That analysis covers marketplace plans only. It does not describe Medicare Advantage, Medicaid or employer plans, and it shows nothing about how fast any payer pays a provider. Be careful with any article that quotes a single payer’s denial rate with no source. We removed a claim like that from an earlier version of this post because we could not verify it.
The one filing deadline you can state with confidence is Medicare’s. Under 42 CFR 424.44, a claim generally must be filed within one calendar year after the date of service, with limited exceptions. Commercial and Medicaid deadlines are set by contract or state rules, so read them.
| Topic | What the source supports | What to check in your own contract or report |
|---|---|---|
| Medicare timely filing | One calendar year after the date of service, with limited exceptions (2026 eCFR text). | Your own internal deadline, well before the limit. |
| Commercial timely filing | No single national rule. It is set in each payer contract. | Filing and corrected-claim windows, in days. |
| Marketplace denial rates | 20% average in 2023; range 1% to 54% across insurers. | Your denial rate per payer, from your own data. |
| Appeals | Fewer than 1% of denied marketplace claims were appealed in 2023. | Appeal deadlines and who owns appeals in your office. |
| Medicaid managed care | State programs; 78% of beneficiaries in comprehensive managed care (2024). | State and MCO billing manuals for your specialty. |
Source: eCFR 42 CFR 424.44; KFF (2023 marketplace data, 2024 Medicaid data).
Also compare what each payer pays against what it should pay. Underpayments hide inside paid claims, so a payer that never denies you can still cost you money. Post remittances against the contracted fee schedule, and keep a short list of the payers and codes where the gap shows up most often.
When denials do come in, the fastest fix is a process that tracks them by payer and reason. Our guide to medical billing denial management explains the workflow, and our denial management services page describes how we run it for practices.
How do you decide which payers to keep, add or drop?
Decide with your own data, in four steps: rank payers by revenue, check what each contract actually pays and requires, confirm enrollment is active, then decide to renew, renegotiate, add or exit. Membership size is a reason to look at a payer, not a reason to sign.
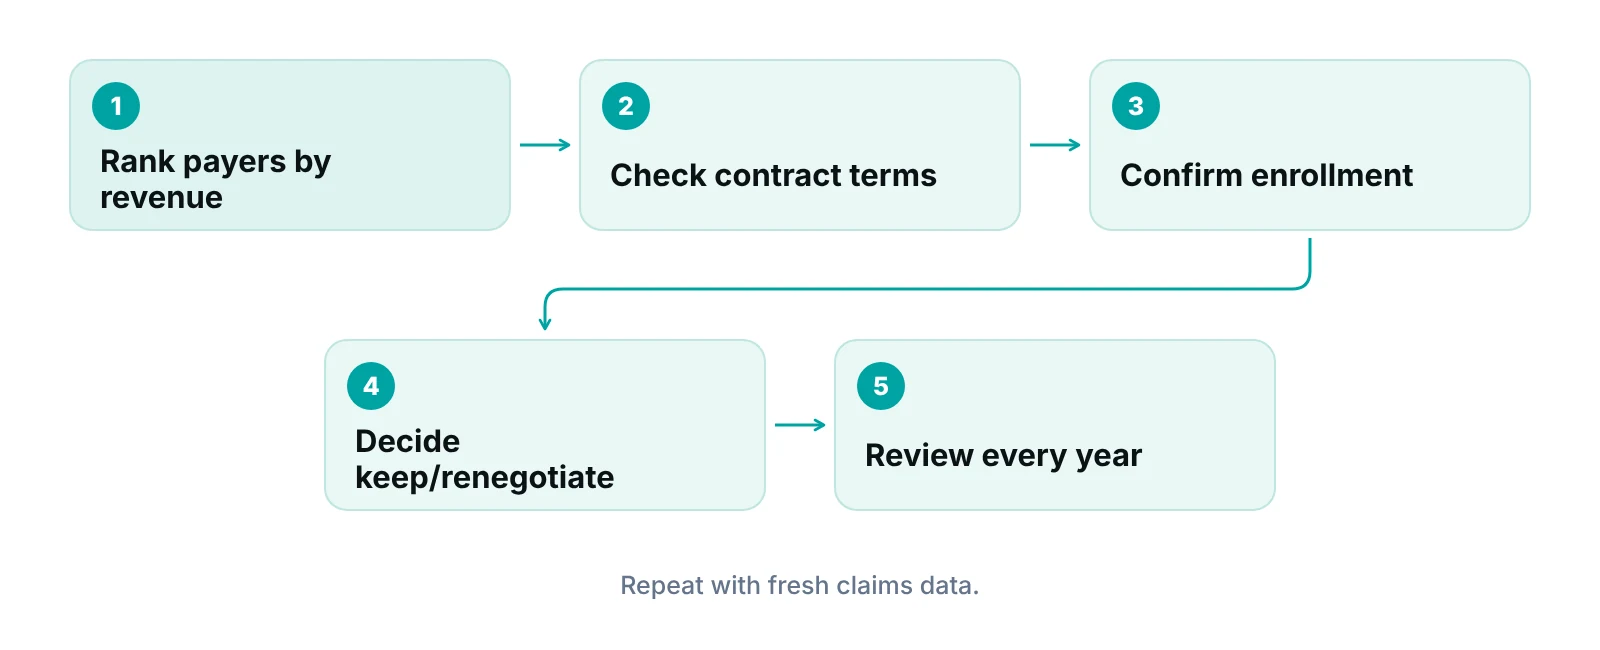
- Rank by dollars. Use 12 months of payments by payer, then mark which payers make up your top share of collections.
- Compare rates to your costs. Check each fee schedule against the services you bill most often. Do this by payer, not as an average.
- Read the operating terms. Look at timely filing, corrected-claim and appeal windows, prior authorization rules and how disputes are handled.
- Confirm enrollment is complete. Each provider and location needs to be active with the payer, with an effective date that covers your visits.
- Decide and document. Record the keep, renegotiate, add or exit decision and the date you will review it again.
Enrollment comes before volume
A new contract does not mean claims will pay on day one. If a provider is not enrolled or the effective date is later than the visit date, claims can be denied or held. Our guide to payer enrollment and credentialing strategies covers the filing steps, and how to get paneled with insurance companies explains how to choose plans.
Want a second look at your payer mix?
Our free practice audit reviews payer mix, denial patterns and A/R by payer so you can see which contracts deserve attention.
What changes by specialty, and who handles enrollment?
Payer mix looks different by specialty. A behavioral health group may lean on Medicaid managed care and a few commercial plans. A surgical group may depend on out-of-network and authorization rules. See our specialty billing pages for how billing patterns differ, then run the payer review for your own specialty.
Enrollment is detailed paperwork that many practices outsource. Our credentialing and payer enrollment services cover applications, follow-up and re-attestation tracking. Our credentialing guide explains the process in more depth.
If you take both Medicare and Medicare Advantage patients, remember they are different payers with different rules, even when the member card looks similar. Our guide to healthcare reimbursement types explains how payment models differ, and our fee-for-service vs value-based care post covers contract models.
Once you decide which payers to hold, you need a way to see how each one performs month to month. A practice management system that tracks claims by stage can show denials and unpaid claims by payer, which makes the annual review faster.
Why does this guide not rank payers or call any of them best?
A ranking of the ‘best’ payers has no fair measure. Membership, payment speed, denial rate and rates paid to providers all differ by state, plan type and specialty, and no public source scores them together. An earlier version of this post listed five payers with promotional claims, including a payer denial rate and member counts we could not tie to a current source. We replaced it with segment data from KFF and a method you can apply to your own claims.
What to do with this data
Use the market figures to understand who you are negotiating with and how concentrated your area is. Use your own remittances to decide whether a contract is worth keeping. See our insurance verification guide and accounts receivable guide for the daily work that supports the decision.
Our recommendations
- Start with your revenue by payer. Start every payer review with 12 months of collected revenue by payer. It tells you in an hour which contracts matter.
- Treat national share as context only. Check your state and county first. A payer with a small national share can still control a large part of your local commercial volume.
- Read timely filing and appeal windows. Put each contract’s filing, corrected-claim and appeal windows in one sheet. Medicare’s is one calendar year from the date of service; the others are in your contracts.
- Verify enrollment before you promise a start date. Confirm each provider’s effective date with the payer in writing. Do not schedule new-payer patients on an assumed date.
- Track denials and underpayments by payer. Look at denial reasons and remittances against your fee schedule each month. Send errors back while the appeal window is still open.
- Review the mix once a year. Enrollment moves. Humana added over a million Medicare Advantage enrollees between February 2025 and February 2026 while others lost members. Re-check the mix on a schedule.
Track denials and unpaid claims by payer in one place.
Our practice management system tracks each claim by stage with an owner and shows reporting dashboards, which gives you the payer-level data used in the review above.
See how the RCM Finder portal works · Create a portal account
Disclosure: RCM Finder builds and sells this portal. It is a practice management system, not an EHR.
Bottom line
The top healthcare payer companies differ by market and by state, so the right question is which payers drive your revenue and what their contracts require. If you want help reading your own payer data or getting enrollment done correctly, see our credentialing services or try the revenue calculator to size what slow payments cost you.
Frequently asked questions
Who are the top healthcare payer companies in the US?
It depends on the market. In Medicare Advantage, UnitedHealthcare and Humana together held 47% of enrollment in KFF’s 2024 data. In the ACA individual market, Centene was largest in 2024 at 18%. In Medicaid managed care, Centene, UnitedHealth Group, Elevance, Molina and Aetna/CVS together held 47% in 2024.
What is the difference between payer and payor?
There is no practical difference. Both words mean an organization that pays for healthcare services, such as Medicare, a state Medicaid program or a commercial insurer. ‘Payer’ is more common in current US usage and in KFF and CMS publications; ‘payor’ still appears in some contracts and older articles.
Should my practice contract with the largest payers?
Not automatically. Check how much of your revenue each payer would represent, what the fee schedule pays for your common services and what the contract requires for filing, authorization and appeals. A large payer in your state may be worth it; a large national payer with little local presence may not be.
Do large payers deny more claims?
The evidence we verified does not link size to denial rate. KFF found that marketplace plans denied 20% of in-network claims on average in 2023, with individual insurers from 1% to 54%. That covers marketplace plans only, so measure your own denials by payer.
How long do I have to file a claim with a payer?
For Medicare, a claim generally must be filed within one calendar year after the date of service, under 42 CFR 424.44, with limited exceptions. Commercial and Medicaid managed care deadlines are set by contract or state rules, so check each one.
How do I get enrolled with a payer I want to add?
Apply to the payer, usually with your NPI, tax ID, license details and CAQH profile where the payer uses it, then confirm the effective date in writing before scheduling its members. Timing differs by payer, so start early. Our payer enrollment guide walks through the steps.
Get your free practice audit
Tell us about your practice. We will contact you using the details you give.
- A review of your recent claims, denials and A/R aging
- Where your front desk and prior authorizations slow payment
- A prioritized fix list you keep, whether or not you hire us
Pricing is quoted after the audit, based on your volume and the services you choose. Prefer to talk? Call +1 (302) 556-2288.
Sources
- Medicare Advantage competition and market concentration (2024 county data) — KFF (2025)
- Medicare Advantage Enrollment Grew by About 1 Million People, Mainly Due to Special Needs Plans — KFF (2026)
- 10 Things to Know About Medicaid Managed Care — KFF (2025)
- Market Share and Enrollment of Largest Three Insurers – Individual Market — KFF (2024)
- Claims Denials and Appeals in ACA Marketplace Plans in 2023 — KFF (2025)
- 42 CFR 424.44 Time limits for filing claims — eCFR (U.S. Government) (2026)
Disclaimer: This article is educational and is not legal, coding, contracting or compliance advice. Payer rules, contracts and state requirements vary and change; confirm current terms with each payer and your counsel. Market figures are from the cited sources and years and are not forecasts.